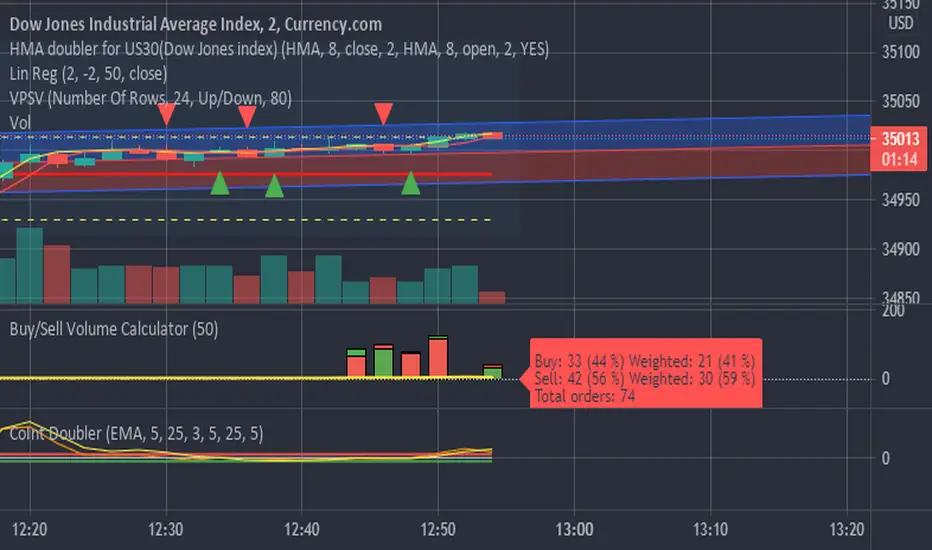
Buy/Sell Volume CalculatorThis script is calculating difference between buy and sell orders, realtime when the candle is build, using the accessible data.
Since we do not know how many stocks every single trade is executing, It only can use number of trades, showing how many trades resulting in price raising or lowering.
But it seems to be pretty god anyway.
The script is supposed to be a fine tuning when a trade is running, and early signals is needed.
When the green candle is larger than the red, price is supposed to rice, and the other way around when the red candle is larger the the green.
It calculate ONLY realtime. When starting the script there is no data, until candlesticks is builded.
Buscar en scripts para "Buy sell"
Buy/Sell/Hold/Away? This script based on Simple Moving Average and Exponential Moving Average.
The Red Line is an exponential moving average with small length. It act as a main line.
The Black Line is an average of some past data of exponential moving average. Act as Trend Line
The green circles is an exponential moving average with medium length. It act as a signal line.
The Idea is, when the price move higher from it past,past,past, repeatedly in some duration, it will gain enough energy to fly to the highest.
Buy signal when red line cross down green circle. strong buy when red line cross down black line.
Sell signal when red line cross down green circle. strong buy when red line cross down black line.
Additional 1:
Triangle up(blue) indicate Buy Signal. it happen when the price break resistant with some condition and volume>1m
Triangle down(maroon) indicate Sell Signal. it happen when the price break support with some condition and volume>1m
The more triangle show in series, the strong the trend to move accordingly.
Additional 2:
Support and Resistance line.
Hope Benefit To You All.

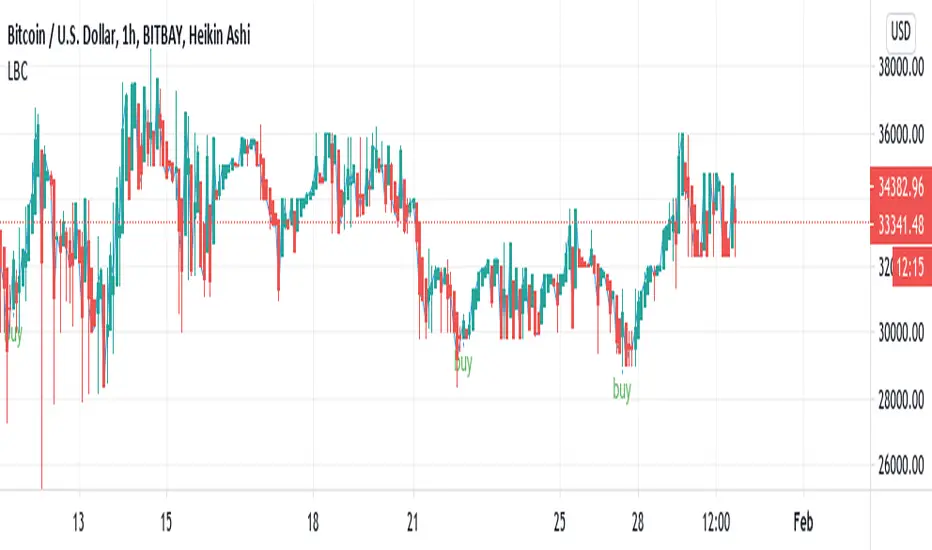
Buy/Sell Reversal Indicator, Lane CritchellThis indicator essentially just finds reversal points on the graph, and labels them buy. Currently working on sell/close trade alerts. Strategy I have used a little bit with some success is entering a trade when it says buy, taking profit at 1% and setting a stop loss at 0.5%. On the 1 hour timeframe I do (still looking into backtesting to see accuracy of other timeframes.
Buy/Sell Volume BarsCalculates buy and sell volume on each candle. Recommended only for visual use - sell volume is same as "total volume" so it will not get covered by buyvolume.

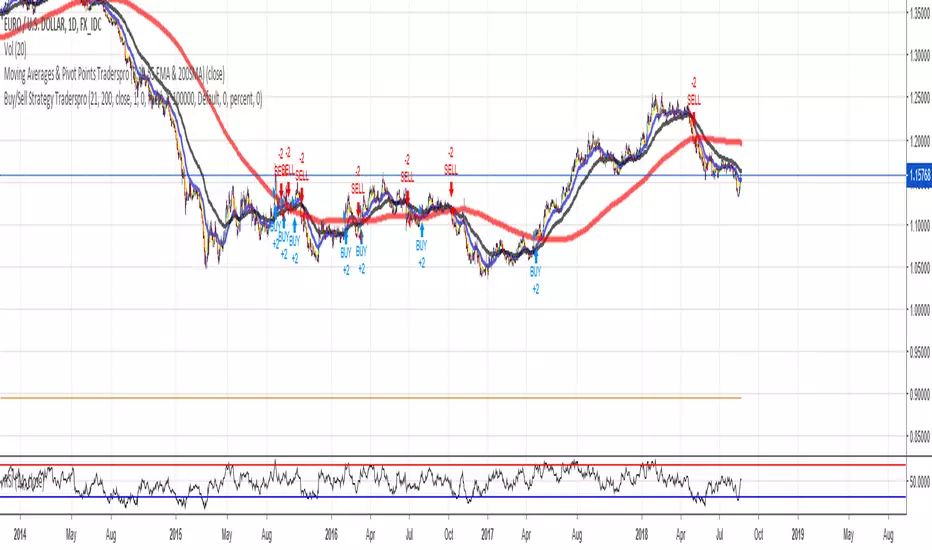
Buy/Sell Strategy Traderspro 21EMA/200SMA & PivotsBuy Signal: If price closes over EMA 21 and SMA 200 and over Montly and weekly pivots.
Sell Signal: If price closes below EMA 21 and SMA 200 and below Montly and weekly pivots.
Use buystops sellstops over signal bar close
For EURUSD Daily Timeframe works better. Check other pairs to see which timeframe has better profits. I apreciate your comments

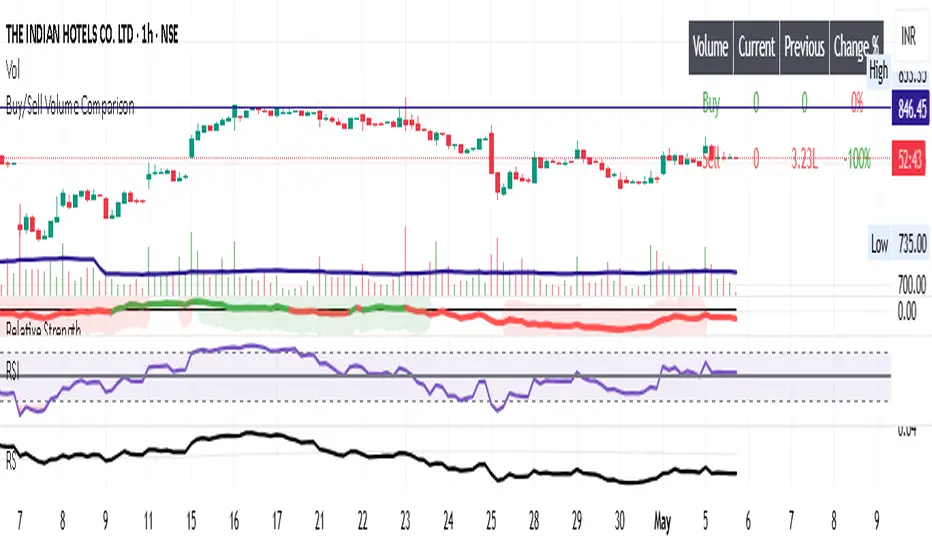
Buy/Sell Volume ComparisonKey improvements:
Direct volume comparison: Now shows the current day's volume and previous day's volume side by side
Percentage change display: Clear percentage change with up/down arrows
Table position customization: Added a dropdown menu to select where you want the table to appear
To adjust the table position:
Click on the settings (gear icon) for the indicator after adding it to your chart
You'll see a dropdown menu labeled "Table Position"
Select from options like "Top Right", "Bottom Left", etc.
Click "OK" to apply your changes
This version also handles the case where there's no previous volume data (first bar of the chart) by checking for NA values.
Let me know if this meets your requirements, or if you'd like any other adjustments!RetryClaude does not have the ability to run the code it generates yet.Claude can make mistakes. Please double-check responses.Tip: Long chats cause you to reach your usage limits faster.
Buy/Sell EMA CandleThis indicator is designed to display various technical indicators, candle patterns, and trend directions on a price chart. Let's break down the code and explain its different sections:
Exponential Moving Averages (EMA):
The code calculates and plots five EMAs of different lengths (13, 21, 55, 90, and 200) on the price chart. These EMAs are used to identify trends and potential crossovers.
Engulfing Candle Patterns:
The code identifies and highlights potential bullish and bearish engulfing candle patterns. It checks if the current candle's body size is larger than the combined body sizes of the previous and subsequent four candles. If this condition is met, it marks the pattern on the chart.
s3.tradingview.com
EMA Crossovers:
The code identifies and highlights points where the shorter EMA (ema1) crosses above or below the longer EMA (ema2). It plots circles to indicate these crossover points.
Candle Direction and RSI Trend:
The code determines the trend direction of the last candle based on whether it closed higher or lower than its open price. It also calculates the RSI (Relative Strength Index) and determines its trend direction (overbought, oversold, or neutral) based on predefined thresholds.
s3.tradingview.com
Table Display:
The code creates a table displaying trend directions for different timeframes (monthly, weekly, daily, 4-hour, and 1-hour) for candle direction and RSI trends. The trends are labeled with "L" for long, "S" for short, and "N/A" for not applicable.
High Volume Bars (HVB):
The code identifies and colors bars with above-average volume as either bullish or bearish based on whether the price closed higher or lower than it opened. The color and conditions for high volume bars can be customized.
s3.tradingview.com
Doji Candle Pattern:
The code identifies and marks doji candle patterns, where the open and close prices are very close to each other within a certain percentage of the candle's high-low range.
RSI-Based Candle Coloring:
The code adjusts the color of the candles based on the RSI value. If the RSI value is above the overbought threshold or below the oversold threshold, the candles are colored yellow.
Usage and Interpretation:
Traders can use this indicator to identify potential trend changes based on EMA crossovers and candle patterns like engulfing and doji.
The RSI trend direction can provide additional insight into potential overbought or oversold conditions.
High volume bars can indicate potential price reversals or continuation patterns.
The table provides an overview of trend directions on different timeframes for both candle direction and RSI trends.
Keep in mind that this is a complex indicator with multiple features. Users should carefully evaluate its performance and consider combining it with other indicators and analysis methods for more accurate trading decisions.
The table is designed to provide a consolidated view of trend directions and other indicators across multiple timeframes. It is displayed on the chart and organized into rows and columns. Each row corresponds to a specific aspect of analysis, and each column corresponds to a different timeframe.
Here's a breakdown of the components of the table:
Row 1: Separation.
Row 2 (Header Row): This row contains the headers for the columns. The headers represent the different timeframes being analyzed, such as Monthly (M), Weekly (W), Daily (D), 4-hour (4h), and 1-hour (1h).
Row 3 (Content Row): This row contains labels indicating the types of information being displayed in the columns. The labels include "T" for Trend, "C" for Current Candle, and "R" for RSI Trend.
Row 4 and Onwards: These rows display the actual data for each aspect of analysis across different timeframes.
For each aspect of analysis (Trend, Current Candle, RSI Trend), the corresponding rows display the following information:
Monthly (M): The trend direction for the given aspect on the monthly timeframe.
Weekly (W): The trend direction for the given aspect on the weekly timeframe.
Daily (D): The trend direction for the given aspect on the daily timeframe.
4-hour (4h): The trend direction for the given aspect on the 4-hour timeframe.
1-hour (1h): The trend direction for the given aspect on the 1-hour timeframe.
The trend directions are represented by labels such as "L" for Long, "S" for Short, or "N/A" for Not Applicable.
The table's purpose is to provide a quick overview of trend directions and related information across multiple timeframes, aiding traders in making informed decisions based on the analysis of trend changes and other indicators.


Buy/Sell SignalsThe indicator is built using Supertrend, RSI, and Ema Crossovers.
What is the best way to use the indicator?
Indicator can be used in two ways:
First : If a signal appears on the chart, you can enter immediately the stoploss is the candle's low with a Small Buffer.
Second: you will get good results if you plot additional indicators like as volume, RSI and so on for additional confirmation to get better results


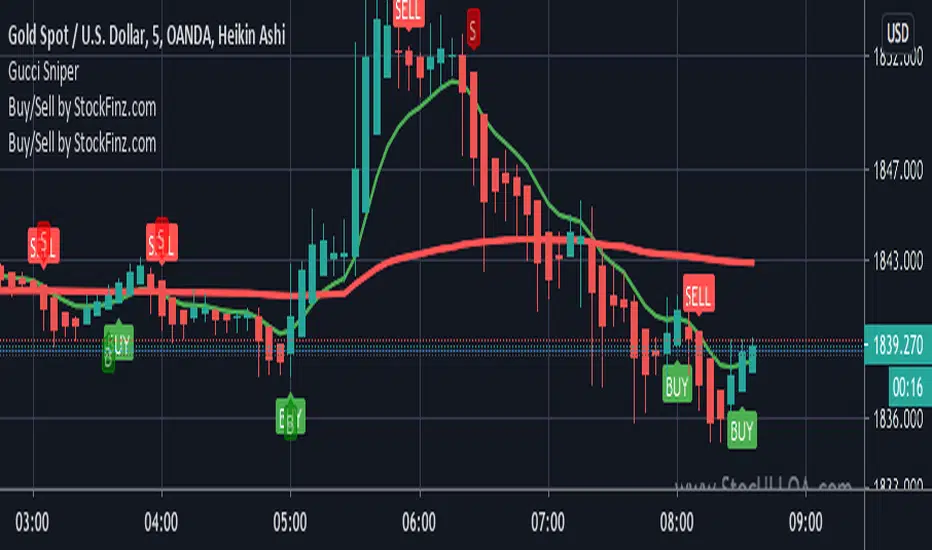

Buy Sell SignalsFinding the high winning percentage trade signals.
It will be public for a month.
If you like it, please message me

Buy Sell SignalsFinding the high winning percentage trade signals.
It will be public for a month.
If you like it, please message me


MULTIPLE TIME-FRAME STRATEGY(TREND, MOMENTUM, ENTRY) Hey everyone, this is one strategy that I have found profitable over time. It is a multiple time frame strategy that utilizes 3 time-frames. Highest time-frame is the trend, medium time-frame is the momentum and short time-frame is the entry point.
Long Term:
- If closed candle is above entry then we are looking for longs, otherwise we are looking for shorts
Medium Term:
- If Stoch SmoothK is above or below SmoothK and the momentum matches long term trend then we look for entries.
Short Term:
- If a moving average crossover(long)/crossunder(short) occurs then place a trade in the direction of the trend.
Close Trade:
- Trade is closed when the Medium term SmoothK Crosses under/above SmoothD.
You can mess with the settings to get the best Profit Factor / Percent Profit that matches your plan.
Best of luck!

[STRATEGY][RS]MicuRobert EMA cross V2Great thanks Ricardo , watch this man . Start at 2014 December with 1000 euro.


MULTI-CONDITION RSI SIGNAL GENERATOR═══════════════════════════════════════════════
MULTI-CONDITION RSI SIGNAL GENERATOR
═══════════════════════════════════════════════
OVERVIEW:
This indicator generates trading signals based on Relative Strength Index (RSI) movements with multiple confirmation layers designed to filter false signals and identify high-probability reversal opportunities.
═══════════════════════════════════════════════
WHAT MAKES THIS ORIGINAL:
═══════════════════════════════════════════════
Unlike basic RSI indicators that simply plot overbought/oversold crossovers, this system combines FOUR distinct confirmation mechanisms:
1. PERSISTENCE FILTERING - Requires RSI to remain in extreme zones for a minimum duration
2. LOOKBACK VALIDATION - Verifies recent extreme zone visits before signaling
3. DIVERGENCE DETECTION - Identifies price/RSI divergence for stronger signals
4. MOMENTUM CONFIRMATION - Provides trend-continuation entries via midline crosses
This multi-layered approach significantly reduces whipsaw trades that plague simple RSI crossover systems.
═══════════════════════════════════════════════
HOW IT WORKS (TECHNICAL METHODOLOGY):
═══════════════════════════════════════════════
STEP 1: RSI CALCULATION
- Standard RSI calculation using user-defined period (default: 14)
- Monitors two extreme zones: Overbought (default: 70) and Oversold (default: 30)
STEP 2: PERSISTENCE FILTERING
The script counts how many bars RSI has spent in extreme zones within the lookback period:
- For overbought signals: Counts bars where RSI > 70
- For oversold signals: Counts bars where RSI < 30
- Signal only triggers if count >= Minimum Duration (default: 4 bars)
This filters out brief spikes that immediately reverse, focusing on sustained extreme conditions that are more likely to lead to genuine reversals.
STEP 3: LOOKBACK VALIDATION
- Checks if RSI reached extreme zones within the Lookback Bars period (default: 20)
- Uses ta.highest() and ta.lowest() functions to verify recent extremes
- Ensures we're trading reversals from meaningful extremes, not random crossovers
STEP 4: BASIC SIGNAL GENERATION
- BUY SIGNAL: RSI crosses above the oversold level (30) after meeting persistence and lookback conditions
- SELL SIGNAL: RSI crosses below the overbought level (70) after meeting persistence and lookback conditions
STEP 5: DIVERGENCE DETECTION
The script identifies two types of divergence over the Divergence Lookback period (default: 5 bars):
A) BULLISH DIVERGENCE (indicates potential upward reversal):
- Price makes a lower low (current low < previous low)
- RSI makes a higher low (current RSI low > previous RSI low)
- Suggests weakening downward momentum
B) BEARISH DIVERGENCE (indicates potential downward reversal):
- Price makes a higher high (current high > previous high)
- RSI makes a lower high (current RSI high < previous RSI high)
- Suggests weakening upward momentum
STEP 6: STRONG SIGNAL CONFIRMATION
- STRONG BUY: Basic buy signal + bullish divergence present
- STRONG SELL: Basic sell signal + bearish divergence present
- These represent the highest-probability setups
STEP 7: MOMENTUM SIGNALS (OPTIONAL)
- MOMENTUM BUY: RSI crosses above 50 after being oversold (trend continuation)
- MOMENTUM SELL: RSI crosses below 50 after being overbought (trend continuation)
- Smaller signals for traders who want trend-following entries
═══════════════════════════════════════════════
SIGNAL TYPES AND VISUAL INDICATORS:
═══════════════════════════════════════════════
📈 GREEN TRIANGLE (below bar) - Standard Buy Signal
RSI crossed above oversold level with confirmation filters
📉 RED TRIANGLE (above bar) - Standard Sell Signal
RSI crossed below overbought level with confirmation filters
🔵 BLUE TRIANGLE (below bar) - Strong Buy Signal
Buy signal + bullish divergence (HIGHEST PRIORITY)
🟣 PURPLE TRIANGLE (above bar) - Strong Sell Signal
Sell signal + bearish divergence (HIGHEST PRIORITY)
🟢 GREEN CIRCLE (small) - Momentum Buy
RSI crosses above 50 after oversold conditions
🔴 RED CIRCLE (small) - Momentum Sell
RSI crosses below 50 after overbought conditions
BACKGROUND SHADING:
- Light red background: RSI currently overbought
- Light green background: RSI currently oversold
═══════════════════════════════════════════════
PARAMETER SETTINGS:
═══════════════════════════════════════════════
1. OVERBOUGHT LEVEL (default: 70, range: 50-90)
- Higher values = fewer but stronger overbought signals
- Lower values = more sensitive to overbought conditions
- Recommended: 70 for standard markets, 80 for crypto/volatile assets
2. OVERSOLD LEVEL (default: 30, range: 10-50)
- Lower values = fewer but stronger oversold signals
- Higher values = more sensitive to oversold conditions
- Recommended: 30 for standard markets, 20 for crypto/volatile assets
3. RSI PERIOD (default: 14, range: 2-50)
- Standard RSI calculation period
- Lower = more sensitive/faster signals
- Higher = smoother/slower signals
- Recommended: 14 (industry standard)
4. MINIMUM DURATION (default: 4, range: 1-20)
- Required bars in extreme zone before signal
- Higher values = fewer signals but better quality
- Lower values = more signals but more false positives
- Recommended: 3-5 for day trading, 5-10 for swing trading
5. LOOKBACK BARS (default: 20, range: 5-100)
- How far back to check for extreme zone visits
- Should match your typical trading timeframe
- Recommended: 20 for intraday, 50 for daily charts
6. DIVERGENCE LOOKBACK (default: 5, range: 2-20)
- Period for comparing price/RSI highs and lows
- Lower values = more frequent divergence signals
- Higher values = more significant divergences
- Recommended: 5-10 depending on timeframe
═══════════════════════════════════════════════
HOW TO USE THIS INDICATOR:
═══════════════════════════════════════════════
RECOMMENDED TRADING APPROACH:
1. PRIMARY ENTRIES: Focus on Strong Buy/Sell signals (blue/purple triangles)
- These have the highest win rate due to divergence confirmation
- Wait for price action confirmation (support/resistance, candlestick patterns)
2. SECONDARY ENTRIES: Regular Buy/Sell signals (green/red triangles)
- Use these when Strong signals are infrequent
- Require additional confirmation from other indicators or chart patterns
3. TREND CONTINUATION: Momentum signals (small circles)
- Best used when overall trend is clear
- Not recommended for reversal trading
4. FILTER TRADES: Use background shading as context
- Be cautious entering longs when background is red (overbought)
- Be cautious entering shorts when background is green (oversold)
RISK MANAGEMENT GUIDELINES:
- Never risk more than 2-5% of capital per trade
- Use stop losses below recent swing lows (buys) or above swing highs (sells)
- Target at least 1.5:1 reward-to-risk ratio
- Consider position sizing based on signal strength
TIMEFRAME RECOMMENDATIONS:
- 15min - 1hour: Day trading with adjusted parameters (lower minimum duration)
- 4hour - Daily: Swing trading with default parameters
- Weekly: Position trading with increased lookback periods
COMPLEMENTARY TOOLS:
This indicator works best when combined with:
- Support and resistance levels
- Trend indicators (moving averages, trend lines)
- Volume analysis
- Price action patterns (engulfing candles, pin bars)
═══════════════════════════════════════════════
LIMITATIONS AND CONSIDERATIONS:
═══════════════════════════════════════════════
- This is NOT a standalone trading system - requires additional analysis
- RSI-based strategies perform best in ranging/choppy markets
- May generate fewer signals in strong trending markets
- Divergence signals can be early - wait for price confirmation
- Not recommended for highly illiquid assets
- Backtest on your specific market before live trading
- No indicator is 100% accurate - always use proper risk management
═══════════════════════════════════════════════
TECHNICAL NOTES:
═══════════════════════════════════════════════
- Code is original and does not reuse external libraries
- Uses Pine Script v5 native functions only
- Alert conditions included for all signal types
- No repainting - signals appear and remain fixed
- Efficient calculation methods minimize processing load
═══════════════════════════════════════════════
ALERT SETUP:
═══════════════════════════════════════════════
Four alert conditions are available:
1. "Buy Alert" - Triggers on standard buy signals
2. "Sell Alert" - Triggers on standard sell signals
3. "Strong Buy Alert" - Triggers on divergence-confirmed buy signals
4. "Strong Sell Alert" - Triggers on divergence-confirmed sell signals
To set up alerts: Right-click chart → Add Alert → Select desired condition
═══════════════════════════════════════════════
This indicator is provided for educational and informational purposes. Always practice proper risk management and never trade with money you cannot afford to lose.
